How do we baseline our current process and understand the benefits of change?
I attended the MHCLG Roadshow in Bristol this week. One of the sessions I attended was one titled something like ‘How do we understand and baseline our current process so that we can measure the benefits of changes?’.
This is a common problem and fortunately is one that is easy to solve. Process Mapping using traditional tools does help you get an understanding of the flow of your processes but it does not help you understand the costs. You can use your process mapping to work out a complex calculation of the current costs but this is time consuming and subject to error. Any calculations are not connected to the process map so any amendments(and there are generally lots of these) have to be reflected back into the calculation.
In the Public Sector it is important in almost everything we do that we understand the benefits and I would argue it is essential part of helping you decide what changes you should be making to get best value for the publics pound. Fortunately this is easy when you use the right tools so lets have a look.
So how can we do it?
In order to understand the costs of you current process you must first understand what is going on in that process. For this you need just a few things
Permission and buy in to the process mapping from the process owners
A room to hold a workshop with screen and projector/TV
The process actors from across the entire value stream who can tell you how the process is done in each area
There are a number of things you can cover in these workshops but for this post we will address the elements that you need to do to achieve the outcome of baselining your current process and comparing this to proposed changes.
Lets have a look at a simple example of mapping a cup of tea round.
Process Mapping A Cup Of Tea
Capture your Process Map
The first thing we need to do is to capture the end to end process in detail. Instead of just putting shapes on a map (or actually in a workshop post its on brown paper), we capture the map live in the workshop projected on the screen (also saving your analysts a lot of time). Instead of just capturing a few details about each step we are going to collect all the information live in the workshop as it is discussed.
If you want to have a look at why this is a good thing to do with real examples look at our recent blog ‘Act on the cause not the symptoms‘
With our software you can actually capture the data as its discussed and then use it to help you improve. Again there is so much data you can capture but we will focus on the main information to achieve the baseline. The software has been developed for over 15 years now as a workshop friendly tool designed to capture live in workshops. All the challenges with existing clunky process mapping tools have been addressed. You never draw a line the map builds itself. If you put something in the wrong place no problem drag it to the right place. If you need to insert something in the map just click there and start building or copy/paste it in.
Not only do you get better outcomes by using this modelling tool it also saves your analysts time in write ups and engages stakeholders more as the map they receive back is the same as they remember building.
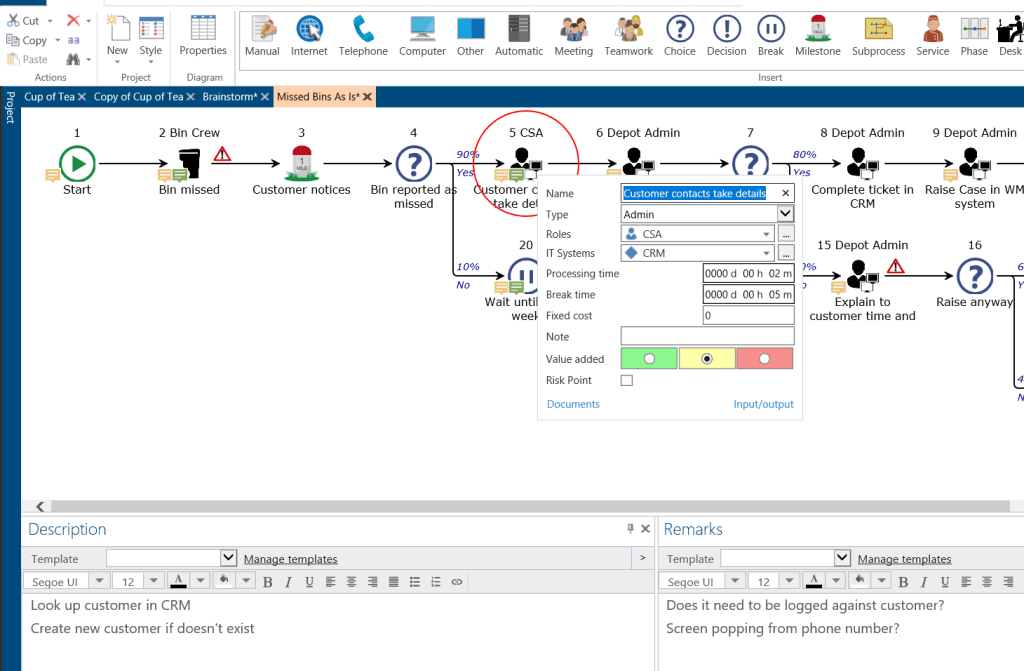
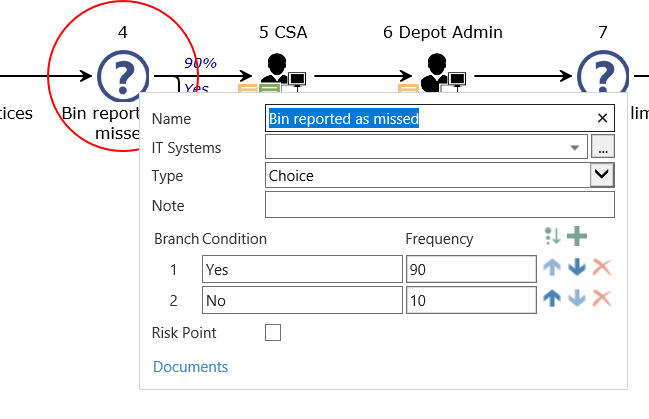
The data you can capture against each step is as follows
Name – brief description of step
Type – step type like telephone, computer or automatic tasks
Description – full description of what is done
Roles – the role(s) that does the step
IT Systems – Other details like IT System that performs the step
Processing time – the time it takes a person to process this step
Break time – how long does a process wait before the task is done
Fixed costs – any fixed costs involved in the step like print or post
Value added indicator – either the step is customer value(green), business value(amber) or waste(red)
Highlight whether the step is a risk point
Add documents or links to work instructions
Add the inputs and outputs to the step
Remarks – capture all the challenges and improvement ideas identified in this step
With the process actors in the room it is easy to understand and estimate both the wait time and the processing time for each step. Depending on how a step is and how confident the estimates were you may want to do some sampling to refine the numbers post workshop. As the conversation around the process is happening you can capture the description and any improvement ideas as well as any inputs or outputs.
As you look at each step you are also able to classify each step with whether it is
Customer Value – the elements of a process a customer would ‘pay’ for
Business Value – elements we need to do for the business value i.e. key into systems, gather info for reporting, legislative steps
Waste – anything other than the above. This is what you are trying to remove
Any branches/decisions in the process you are also putting the percentages or numbers going down each branch.
Time to start to analyse
Analysis is a key part of traditional process mapping tools that is missing. BPNM or Visio process mapping gives you a visual representation of your process and nothing more. The conversations in the room will have given you lots and maybe you have kept notes but those notes aren’t held against the areas of the map they apply to they will just be notes. You may annotate the map with some but that is not the most help.
Because you have captured data against the steps you can now use that in a multitude of ways to help you identify areas in the process to improve. Data held within the system can be analysed and presented in many ways. In Visio if you want to turn a value stream map into a role swimlane this is a new map in our software its a button click. If you have added IT systems you can do this too. Also you can have a value add swimlane splitting up the customer and business value from the waste.
You can turn on the value add indicators, inputs and outputs and also many other things to help you review the process and the value from different perspectives. It helps you answer many analysis questions.
The Baseline
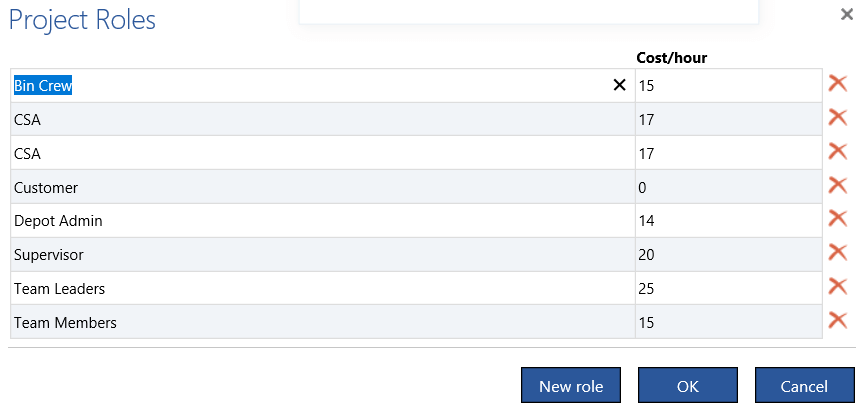
At the moment we have only put enough data in to understand the process times and some fixed costs. This is excellent data but to make the next step and get the full process costs is easy again(this may be a common phrase but this stuff is easy with the right tools and the right people to help you!). To get to the full process costs all we need to do is add the role cost per hour. The way this is calculated for projects vary organisation to organisation but in truth is just mean point of salary range (per hour) plus whatever on costs and other costs that are used to calculate cost of a person for finance colleagues.
Pop this data into the roles table for your process and we can now calculate costs.
So what are our baseline costs?
The analysis is strong in you!
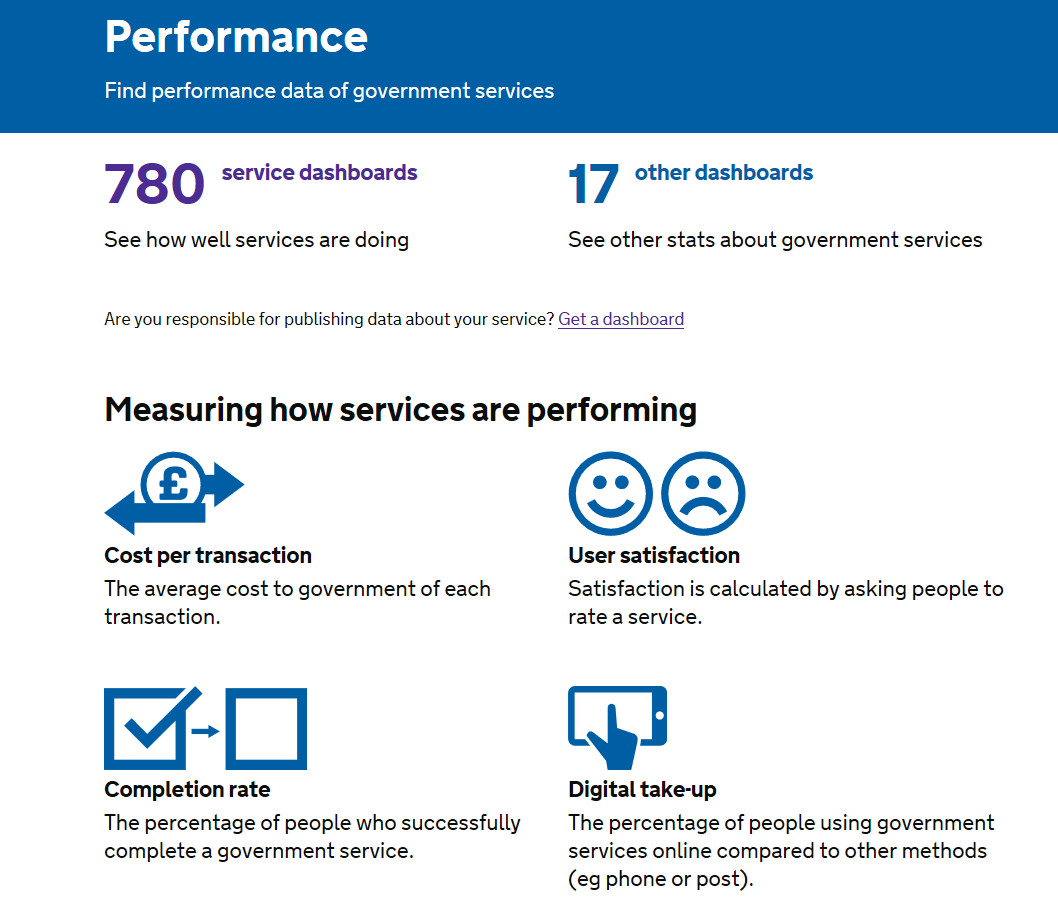
One of the key monitoring tools for GDS is the Performance Platform. It is the 4 key measures all GDS projects will have to report for the projects they are doing. One of the most critical measures in here is the cost of service. Below we look at how you can generate that.
Now we have the role costs we can look at the total costs of the process and do even more analysis. Again the tools in the system help. We can look at the total costs but we can equally look at parts of the process and understand costs/times. Any statistical measure you have switched on (too many to list) you can use show measures to highlight your bottlenecks. You can also annotate the processes with any of the measures.
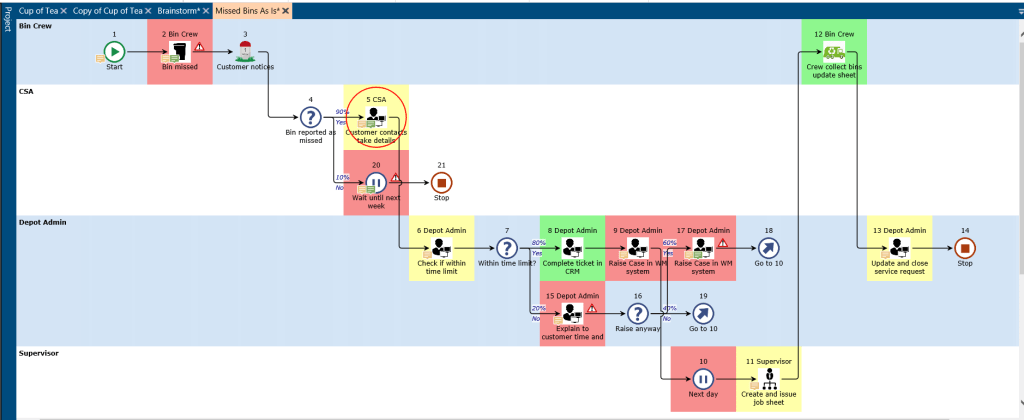
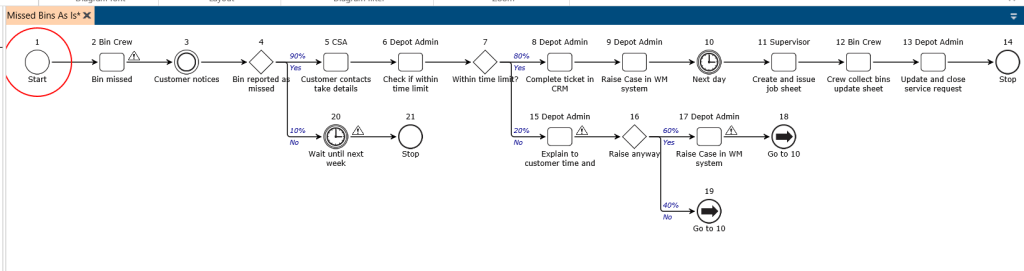
For example imagine you want to interpret the map and identify via a RAG indicator the statistically best, middle and worst steps from a particular measure. For Public Sector I would argue the most important is total cost. So lets look at the map as a Visio/BPMN map and the view in the lean process platform.
So BPMN/Visio map of process showing data to help you identify Total Cost of Missed Bins
In our software ask yourselves the same question
So quickly and easily we can get to the areas of the process causing the most problems for you key indicators just with the click of a button.
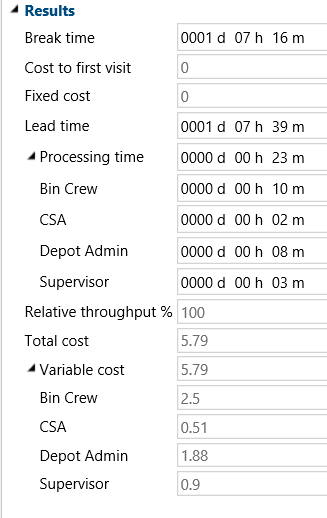
So lets analyse the costs
[/fusion_title][fusion_text]
In order to understand the costs we can just evaluate the process and look at the costs. It is possible to look at the overall costs but also to drill into parts of the process and their costs. Want to know how much it costs us to get to a failure point just click on the end point and you will get the costs/times and the relative throughput. You can also look at individual elements and filter the view to just look at certain parts e.g. filter for a single role to see how much the process costs just for that role.
All of these things help you identify areas of potential improvement but most importantly we now have our baseline for the current service delivery costs.
As I mentioned earlier you may still need to get some further data to confirm these figures by sampling or reports but you have a clear picture of the costs. It is always important to get this signed off by the process owners before considering the next step of improvement.
Process Mapping – Missed Bins
Ok lets look at improvements
So by understanding the current process and spending a day running a workshop we now understand the problems from a customer perspective in our processes. Depending on the type of improvement project whether this is a project piece of work or even just a small BAU change you may now start to use a different approach to refine your proposed changes.
At this stage it is perfectly possible to remodel to start to apply lean and remove some waste and look at those outcomes. You may do this if you already have studied and understood user needs. In many organisations you would now take this learning to inform and agile or design thinking approach to redesign. This should highlight some hypothesis for you to test with your customers.
Whatever approach you use for the next steps when you are ready to start recommending changes to the process, sprints and iterations you should go back into the software and create a new version/s of the maps for the To Be state. Agile/Design thinking will tell you what the users need but lean will tell you whether that user need will deliver the business benefits to justify the investment. Obviously some projects are done irrespective of business benefit say legislative change or political enforced change but the majority are done to deliver benefits ideally to user and business.
Having data to underpin proposed changes helps to de-risk your changes and to ensure that the most beneficial work is done first. Many a project has started with a solution but by actually understanding the process you can focus on the causes not the symptoms.
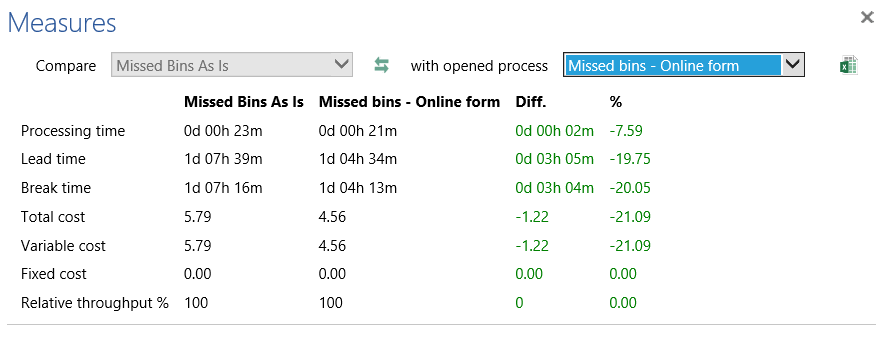
When you remodel your options you can now compare the benefits of change and the savings. In this example the first missed bins is phone only, the second iteration contains an online form and the third contains in cab technology connected to the online forms so that contaminated or not presented bins are rejected for another pick up.
Here is the screenshot of comparing As Is with the first change.
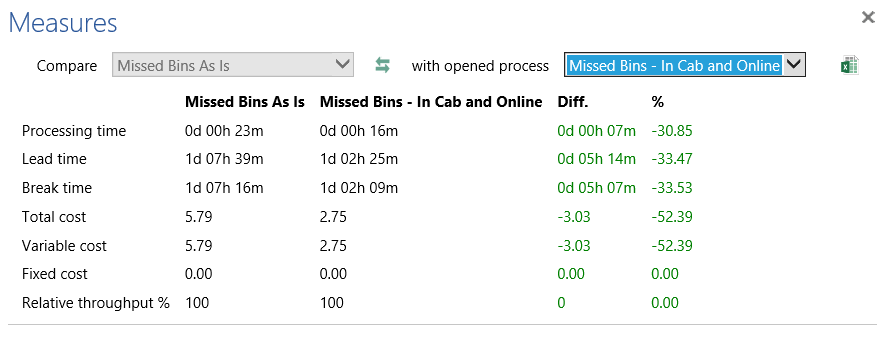
And now compare the original with version 2 the in cab system
So what does this give us?
By having done this exercise in baselining and understanding your processes and their costs you have created a solid footing to move forward and change delivery.
You have a solid platform now to decide if you should commission change in this process
You have generated ideas around what is currently going wrong to impact on the delivery of user needs
You have identified ideas to be tested with users
You have got all process actors together to create a shared understanding of the current process and its challenges
You have a detailed understanding that can be given to developers to deliver the final solutions
You have a baseline you can measure proposed changes against to ensure you are delivering value changes
What is not to like? All this is achieved basically in a single day workshop for a complex process. Traditional methods of capture take significantly longer and do not get the same outcomes.
For more information on why mapping is vital in 2019 try our other blog ‘Why 2019 is the year to get serious about process’
Even more importantly you can try this for nothing and in the free months trial you can achieve all of this with very little training (which you also get free). You can do this and you can do it easily with the right tools.Tools also support inexperienced analysts being able to achieve these outcomes consistently due to the power of the functions in the software platform.
If you have processes and you want to improve them no matter what methodology you are using you should follow 33% of Dutch LA’s and over 30 UK LA’s in giving it a try (for free!)
https://meetings.hubspot.com/andrew-sandford/new-meeting

 With the process actors in the room it is easy to understand and estimate both the wait time and the processing time for each step. Depending on how a step is and how confident the estimates were you may want to do some sampling to refine the numbers post workshop. As the conversation around the process is happening you can capture the description and any improvement ideas as well as any inputs or outputs.
As you look at each step you are also able to classify each step with whether it is
With the process actors in the room it is easy to understand and estimate both the wait time and the processing time for each step. Depending on how a step is and how confident the estimates were you may want to do some sampling to refine the numbers post workshop. As the conversation around the process is happening you can capture the description and any improvement ideas as well as any inputs or outputs.
As you look at each step you are also able to classify each step with whether it is
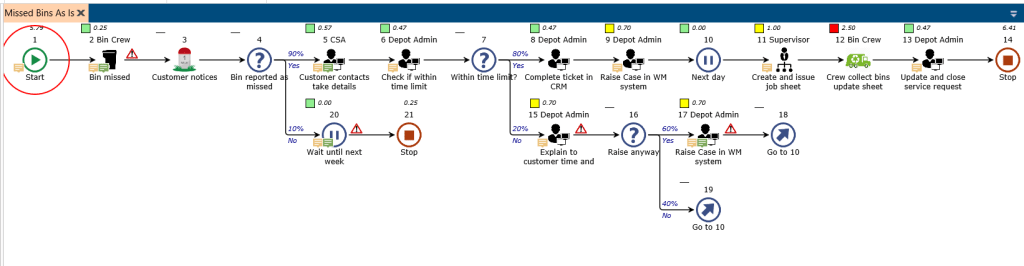 So quickly and easily we can get to the areas of the process causing the most problems for you key indicators just with the click of a button.